About Minot State
About Minot State
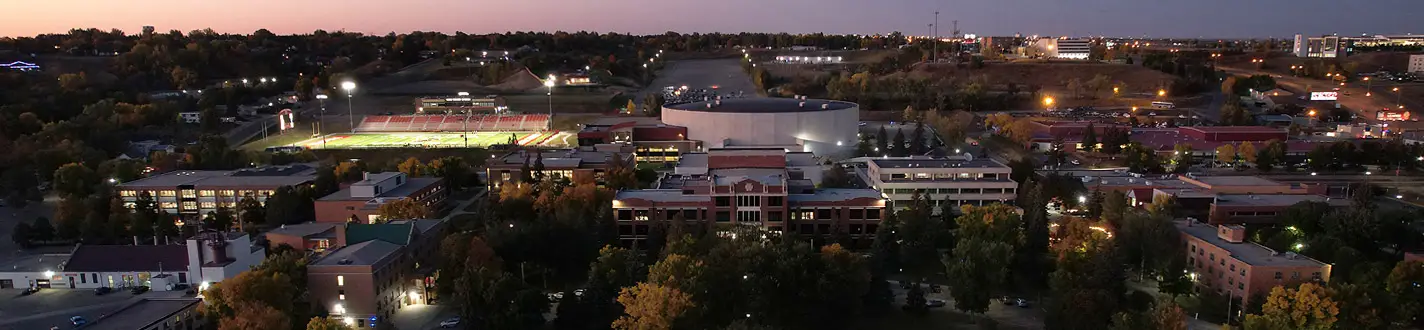
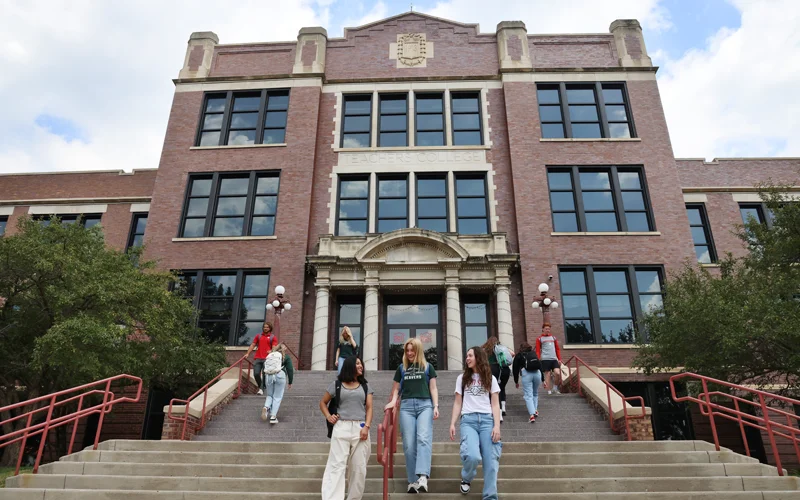
With a nod to the past and a vision for the future, Minot State University empowers generations for today’s world. Founded in 1913 as Minot Normal School, our history began in Model Hall, where future teachers prepared for service in Northwestern North Dakota. As the decades changed, so did our name, campus, and degree offerings.
Today, we are proud to offer 100+ areas of study at the undergraduate and graduate level on a beautiful campus that has grown to over 100 acres in size. Students from our backyard to across the United States and over 55 countries call Minot State home.

Where futures take shape.
| 2,747 total enrollment | |
| 11:1 student-to-professor ratio | |
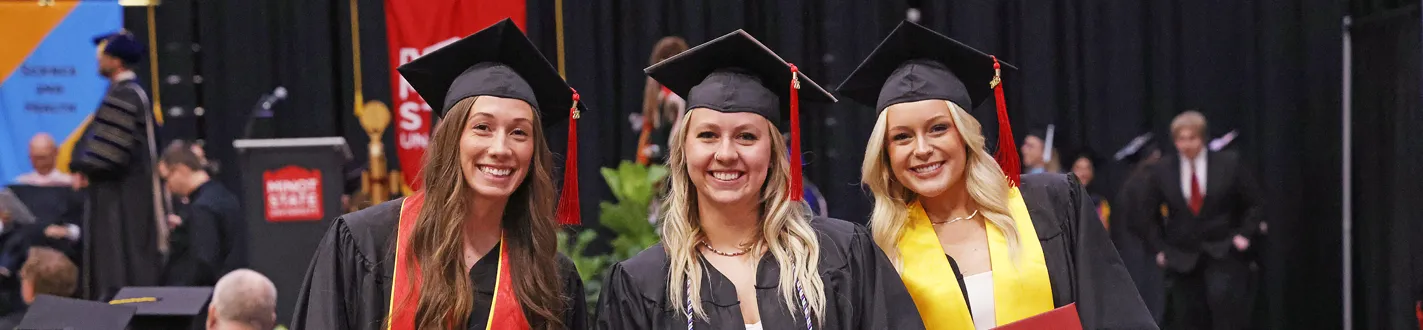
| 96% of grads employed or continuing their education | |
| Nearly $5 million in scholarships & aid awarded annually | |
| 50+ student clubs and organizations |
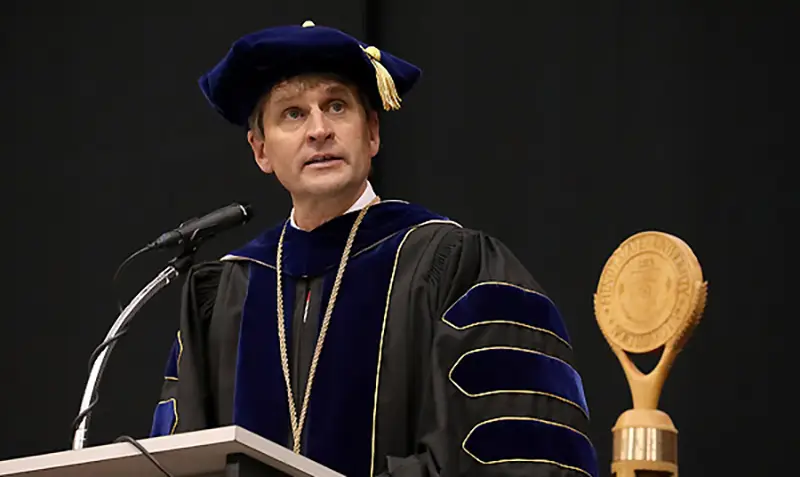
"For over a century, our beloved campus at Minot State has been a beacon of opportunity, hope, and optimism for thousands of students seeking to positively enhance their path in life."

The University
FACTS ABOUT MINOT STATE
Tuition and Fees
Teacher Education Pass Rates
Nursing NCLEX Pass Rates
Alumni
ABOUT MINOT STATE AND MINOT COMMUNITY
Admissions
Campus Map
Accrediting Agencies
Consumer Information
Employment
The City of Minot
Weather Information
INFORMATION RESOURCES
Campus Calendar
Contact Us
Library
State Data Center
University Communications
STUDENT INFORMATION
Academic Support Center
University Communications
Bookstore
Business Office
Computer Help Desk
Career Services
Student Conduct Policy
Continuing Education
Counseling Services
Drug and Alcohol Abuse Prevention
Access Services
Dining Services
Clubs and Student Organizations
Student Government Association
Financial Aid
International Programs
Student Center
Military Resource Center
Residence Life
Student Affairs
Student Health
TRIO - Student Support Services
Safety and Security
Title IX Notice of Non-Discrimination
ACADEMIC PROGRAMS
Academic Calendar
Academic Advising
Center for Extended Learning
International Programs
Career Services
Registrar Information
North Dakota University System
Undergraduate Catalog
Graduate Catalog
ADMINISTRATION OFFICES
Faculty and Staff Directory
Minot State Privacy Policy
Organizational Chart
President's Office
Strategic Plan - Mission and Vision
Student Profile - Fall 2025
| Enrollment Details | Men | Women | Total |
|---|---|---|---|
| Total Headcount | 953 | 1,794 | 2,747 |
| FTE (Full-Time Equivalent) | 798 | 1,430 | 2,228 |
| Full-Time UGRD Students | 665 | 1,108 | 1,773 |
| Part-Time UGRD Students | 239 | 493 | 732 |
| Full-Time GRAD Students | 36 | 83 | 119 |
| Part-Time GRAD Students | 13 | 110 | 123 |
| Year | Headcount |
|---|---|
| Fall 2020 | 2,920 |
| Fall 2021 | 2,836 |
| Fall 2022 | 2,777 |
| Fall 2023 | 2,741 |
| Fall 2024 | 2,751 |
| Fall 2025 | 2,747 |
| Level | Headcount |
|---|---|
| Freshmen | 821 |
| Sophomore | 517 |
| Junior | 463 |
| Senior | 704 |
| Graduate | 242 |
| Total | 2,747 |
| Age | Headcount |
|---|---|
| Under 18 | 189 |
| 18-24 | 1,808 |
| 25-29 | 272 |
| 30-39 | 277 |
| 40-49 | 148 |
| 50-64 | 52 |
| 65+ | 1 |
| Unknown | 0 |
| Total | 2,747 |
| Ethnicity | Headcount |
|---|---|
| 2 or more | 204 |
| American Indian | 55 |
| Asian | 74 |
| Black | 148 |
| Hawaiian | 11 |
| Hispanic | 127 |
| NS | 72 |
| White | 2,056 |
| Total | 2,747 |
| Online ONLY Headcount | UGRD | GRAD |
|---|---|---|
| Degree Seeking | 403 | 158 |
| Non-Degree Seeking | 137 | 0 |
| State | Headcount |
|---|---|
| North Dakota | 1,900 |
| California | 74 |
| Minnesota | 67 |
| Montana | 52 |
| Florida | 49 |
| Gender | Headcount |
|---|---|
| Male | 953 |
| Female | 1,794 |
| Type | Headcount |
|---|---|
| Canada | 184 |
| International (non-Canadian) | 133 |
NEW FRESHMEN ENROLLMENT
| Average HS GPA | 3.22 |
|---|---|
| Average Comp ACT | 20.4 |
| Average Number of Credits Enrolled | 14 |
| Gender | Headcount |
|---|---|
| Male | 174 |
| Female | 232 |
| Major | Headcount |
|---|---|
| Nursing | 49 |
| General Studies | 41 |
| Elementary Ed | 27 |
| Exercise Sci & Rehab | 26 |
| Radiologic Technology | 26 |
| State | Headcount |
|---|---|
| North Dakota | 289 |
| California | 13 |
| Florida | 10 |
| Minnesota | 9 |
| Arizona | 7 |
RETENTION AND GRADUATION RATES
| Year | Rate |
|---|---|
| Fall 2020 | 73% |
| Fall 2021 | 70% |
| Fall 2022 | 72% |
| Fall 2023 | 67% |
| Fall 2024 | 73% |
| (% Full-time, first-time, fall to fall retention) | |
| Year | Rate |
|---|---|
| Fall 2015 | 46% |
| Fall 2016 | 45% |
| Fall 2017 | 48% |
| Fall 2018 | 45% |
| Fall 2019 | 44% |
| (% Full-Time, first-time, graduating within 6 years) | |
| Fall 2015 | Fall 2016 | Fall 2017 | Fall 2018 | Fall 2019 |
|---|---|---|---|---|
| 56% | 53% | 40% | 52% | 55% |
| (% of Full-time, first-time, graduating within 6 years) | ||||
ACADEMIC DEGREES CONFERRED
Degrees Conferred by Type
(Summer '24, Fall '24, and Spring '25)
| Total UGRD Graduates | 480 |
|---|---|
| Associate of Science (AS) | 0 |
| Bachelors of Art (BA) | 62 |
| Bachelors of Applied Science (BAS) | 6 |
| Bachelors of General Studies (BGS) | 19 |
| Bachelors of Individualized Studies | 2 |
| Bachelors of Science (BS) | 217 |
| Bachelors of Science Education (BSE) | 77 |
| Bachelors of Nursing (BSN) | 57 |
| Bachelors of Social Work | 37 |
| Bachelors of Fine Arts | 3 |
| Total GRAD Graduates | 108 |
|---|---|
| Psychology (EDS) | 6 |
| Education (MEDUCAT) | 10 |
| Masters of Science (MS) | 92 |
Certificates (UGRD + GRAD): 32
| Graduates by Ethnicity | Male | Female |
|---|---|---|
| 2 or More | 18 | 12 |
| Am. Indian | 3 | 7 |
| Asian | 5 | 6 |
| Black | 14 | 6 |
| Hawaiian | 1 | 0 |
| Hispanic | 23 | 30 |
| Non-Resident Alien | 36 | 71 |
| Not Specified | 5 | 6 |
| White | 126 | 251 |
| Total Graduates | 231 | 389 |
